Browse Category by Charlotte real estate market
Charlotte real estate market, Getting leads

Could it be [gulp] … a SELLER’S market?

If you’ve been in the business for a few years, we don’t need to tell you that we’ve gone through many years of a strong buyer’s market in most areas.  But the tide seems to be turning.

As of May 1, the following popular neighborhoods in the Charlotte area have fewer than four (4) months inventory:

  • Cameron Wood
  • Beverly Woods
  • Colonial Village
  • Sherwood Forest
  • Merry Oaks
  • Thornhill
  • Adrey
  • Stone Creek Ranch
  • Cady Lake
  • Jetton Cove

To put in perspective — 6 months is considered a “balanced” market, i.e. neither seller’s or buyer’s market.  For most of the past 4 years or so, inventory around Charlotte was anywhere from 9-14 months or so.  But suddenly, inventory is very low in a lot of areas.

What do I do with this info?

Farm, farm, farm!  If there are homeowners in those areas who are even considering selling — now is a great time.  Many (if not most) homeowners have no idea just how much the real estate market has changed in the past year.  The agent to deliver this news may very well be the one to get the listing(s).

And don’t forget that our IDX service comes with an “Absorption widget” that you can put on any website.  This allows you & your clients to see inventory stats for any neighborhood in the Charlotte metro.

Charlotte real estate market

Charlotte neighborhood values: higher than 2007?!

Unless you’ve been living under a rock for the past 5 years, you know that the entire country has gone through a real estate downturn.  Across the country, the “market peak” varied from 2005-2008 or so, and in some areas (i.e. Las Vegas, Phoenix, areas of Florida, etc), values in 2013 are still up to 40-50% lower than they were at the peak.

For the metro Charlotte area, on average, current values are around 13% lower than they were in 2007 (which, in general, was the market peak for the region).  Overall, not too bad.  But surprisingly, some areas are doing quite well.

Here is a chart of the value change of every neighborhood with at least 1 home sold per month.  Yes, some are still struggling, but many are at or near where they were back in 2007, which is pretty remarkable given the severity of the downturn.

Neighborhoods such as The Peninsula, Cedarfield, Midwood, and Birkdale have actually surpassed their 2007 values.  Others, such as Baxter Village, Chantilly, and Piper Glen are within about 5% of the peak.

Given how low inventory is right now (under 6 months in many popular areas), now is a great time to encourage  homeowners in hot areas to put their homes on the market.  Use our market stats plugin or the graphs available in neighborhood analyzer to create content for your blog and/or postcard campaigns.  It’s been a long, long wait, but in some areas it’s actually a seller’s market!

Charlotte real estate market, Getting leads, Tech trends

eValuator: real, accurate property values of Charlotte area homes

If you listen to listing agents these days, there is a common complaint about their competition – namely that they “puff” the value of a home during a listing presentation in order to get the listing.  Usually the home goes on the market at too high a price, and over time the seller either has to reduce the price, or ends up getting sticker shock when someone makes what they consider to be a very low offer.

And it’s easy to see how this happens — where is a seller to go in order to get an unbiased value for their home?  Most people turn to Zillow, but as great as that site is, it doesn’t tend to be very accurate in many cases.

We live, eat and breathe real estate technology, and after hearing our clients tell us these stories over & over, we thought to ourselves:

Why can’t there be a place for a seller to go to get a good, accurate “ballpark” value of their home, like they would for their car with the “Kelley Blue Book” website?

And so, eValuator was born.

We wrote a highly advanced, proprietary “formula” that scans the market and ranks comparable sales for a given property.  Based on those rankings, we produce a value range for a home, and a best guess at an actual price.  Click the screenshot below for a full view:

But that’s not all — with your special administrative login, you can actually create your own custom reports where you choose the comps and rank them yourself.  You can then email the report to your client!

Check out a sample report here to see how it looks.

We are very excited about this product, and our continued commitment to bring you smart, cutting-edge, local real estate technology.

Charlotte real estate market

Tell your sellers: STAGE the home!

I was always very skeptical of home staging. My attitude has always been that if it’s priced right, it will sell. And rather than pay a couple thousand in staging fees, I’ll just be really aggressive with my price. And that was a reasonable attitude… in 2007.

Take this example.

Last year, I had a really nice, renovated SouthPark-area home with a tenant who agreed to cooperate in helping me sell the home. I paid for some landscaping and minor repairs, and then put it on the market at $340k — a very attractive price for the area. We had plenty of showings, but no offers, and eventually withdrew it from the market.

Fast forward 1 year later. This time, the tenant’s lease ended, so they moved out, and I listened to my agent’s advice to stage the home (at least a couple of the “challenging” rooms). Same house, same price, 1 year later (when there are actually statistically fewer homes selling). And guess what? We had 3 offers in the first 2 days on the market.

Certainly, I was impressed, but I’m a numbers guy. There must be some explanation for this.

Price breakdown for Uptown Charlotte

This is a graph of “sold” prices in Uptown Charlotte. Look at the difference between 2007 and 2010.
The $250k-$500k segment has shrunk considerably, and this “pie” represents fewer buyers overall as well. In the meantime, inventory is still pretty high, so the result is you have, relatively, very few willing and able buyers looking in certain price points.

So, it naturally follows that because there are so few buyers, you’ve got to have a near-flawless product, which means: clean, staged, smelling like fresh-baked cookies. Even if your seller is pricing their home aggressively, that isn’t enough these days (compared to 2007, when eventually there’d be a buyer).

So, take it from me, a seasoned real estate investor and former staging skeptic. It’s not even so much a difference of making “X” more dollars on the sale — it’s a matter of whether you’ll find a buyer at all!

Charlotte real estate market

2010 state of the market: stable prices but scarce buyers

2010 is almost “in the books” and the general theme for the year is stable prices but scarce buyers.  Overall activity is slightly up from 2009, but prices are up about 5% on average.  Here are the numbers from the entire Carolina MLS:

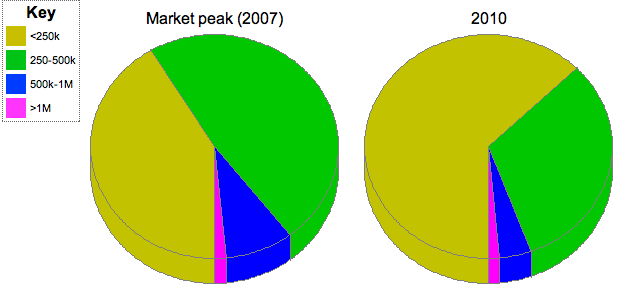
(Note: all charts in this report refer to the market “peak” in 2007 and include both single-family homes and condos)

The higher price ranges bounced back a bit from 2009 even though number of overall sales was stagnant.  So if you were working with a buyer who could buy (as opposed to the glut of “tire kickers” out there these days), chances are they spent a bit more than in 2009.
The “Haves” & the “Have Nots”
Not every area saw similar numbers.  Some areas actually saw fewer sales and/or lower prices from 2009.  The trend seems to be worst for the pricier areas that are not in the most desired school districts.  For example, Area 6-1 (parts of Dilworth, Sedgefield):
The $250-$500k segment was absolutely hammered compared to the peak in 2007, and that also happens to be the average price point of the area.  So, even though the $500k-$1M segment saw some growth, the average price actually went down about 2% (and activity also went down).
Compare this to Area 5-1 (Myers Park, Dilworth) that is in the more desirable school districts:
In this area, activity was up over 40% and prices by 20%!  The $500k-$1M range isn’t close to what it was in 2007 but the over $1M range bounced back nicely from 2009.
Just for fun (or not), here’s Uptown:
Activity was up slightly (though still down a whopping 70% from the market peak), but prices were actually down about 6%.  The main culprit here seems to be both the $250-500k and the $500k-$1M ranges, which were strong at the peak, but now down signficantly.
What lies ahead?
It’s tough to say what’s in store for 2011.  Based on the trends, it would seem safe to assume that just as 2010 was a little better than 2009, 2011 will be a little better than 2010.  The question is how many willing & able buyers have (thus far) chosen not to buy.  With 2009 looking more & more like the true “bottom” in terms of price, it seems reasonable to assume that some of those “scared” buyers will hit the ground in 2011.
In general, it appears that homes in “established” areas with desirable school districts stand to do the best, while previously “hot” areas that experienced a fast rise in value (i.e. Midwood, parts of Dilworth) are a tougher sell because those buyers haven’t come back in full force yet and inventory is high.
If there are any specific areas for which you’d like these stats, we have them easily available!  Just drop us a line!
Charlotte real estate market

End-of-September Carolina MLS market update

Fall is in the air, football season is here… it must be October in Charlotte! But most importantly, how’s the real estate market?

As you might expect, activity has continued to slow since June and the homebuyer tax credit.

Just under 1,300 homes sold in Carolina MLS in September. That’s just over half as many as the 2,550 that sold in June, and about 350 (~20%) fewer than in August. For a little statistical fun (or just if you are in too good a mood today), compare to June, 2007, when a whopping 4,200 homes sold in Carolina MLS! Crazy!

But as we’ve pointed out before, while our activity has markedly dropped over the past couple of years, prices have been relatively stable.

September saw a bit of a dip in price, with the average home going for about $206k, about 6% less than in August. But consider at the market peak in 2007, the average home sold only went for about $230k, so even a bad September is still only about 10% off the peak. And overall, 2010 is still better than 2009 in both activity AND price.

So as we’ve pointed out for several months, 2009 really, REALLY looks like a bottom! If this trend holds, hopefully more of those jittery buyers will come out of the woodwork next spring.

Posted via email from Charlotte real estate technology, IDX, market data

Charlotte real estate market

2007 vs. 2010: what has changed?

In terms of home prices and activity, 2007 represented the peak in metro Charlotte: about 1,250 homes sold per month in Mecklenburg that year, at an average price of $257k.  This year, about 725 houses a month are selling in Mecklenburg, at an average price of $241k.  The prices have only dropped about 6% since the peak, but activity is down about 40%.

These numbers probably don’t look too unfamiliar, so we decided to delve deeper.  Looking at the sold properties from both 2007 and 2010, what trends can we identify?

The first one, you could probably guess.  In 2007, the “under $200k” price bracket represented 58% of the homes sold in Mecklenburg.  The $200-500k range was 35% of homes sold, and the last 7% was homes over $500k.

“Sold” price ranges: 2007

In 2010, interestingly, one of these percentages is identical : the over $500k range!  But homes under $200k are up to 63% of homes sold, and that 5% gain came entirely from the $200k-$500k range, which is down to 30% of homes sold.

“Sold” price ranges: 2010

Other than that 5% “swap” between price ranges, what else is different?  Frankly, not much!  We examined the MLS areas, and found the sales patterns were almost exactly the same.  Area 1 had the most sales in both 2007 and 2010, representing 19% of homes sold in Mecklenburg, followed by Areas 5, 2, 9, 4, and 3.  The percentages stayed virtually the same, with a few of the areas moving by at most 1%.  Areas 5 and 7 were down by 1%, and Areas 2 and 3 were up by 1%.  But otherwise, everything was almost identical.

Area 2007 2010
1 19% 19%
5 16% 15%
2 13% 14%
9 10% 10%
4 9% 9%
3 8% 9%
7 8% 7%
8 7% 8%
6 5% 5%

So what’s to conclude?  Honestly, these numbers show that Charlotte is experiencing many of the same trends as other areas, but unlike some of the hard-hit areas, prices are very stable here.  For prices to have only dropped 6% from the peak is almost remarkable in these times.  If you have any REALTOR friends in Florida or Nevada, ask them how low prices are now compared to the peak, and you will hear percentages like 20 or 30%.

Until next time… Happy Labor Day!

Posted via email from Charlotte real estate technology, IDX, market data

Charlotte real estate market

Almost end-of-summer Carolina MLS market report

If you’ve been watching the news lately, you’ve seen the national numbers: home sales are way down since June 30 (and the end of the home buyer tax credit).  But as a good REALTOR, you know that markets are local — so what’s the story here in Charlotte?

As you may know, about 33% fewer homes were sold in July than were sold in June in CMLS.  And there was another drop-off in August, but not a very big one — 14% fewer homes sold in August than sold in July (though August’s sales represent a 44% drop from June).  

Prices, however, continue be stable in our region.  Despite the lower activity in July, prices actually rose about 4%, though they fell back to near June levels in August.

Looking at the long view, 2010 still is a better year and continues to make 2009 look like “the bottom.”  In 2008, about 2,300 homes sold per month in CMLS.  That dropped to 1,650 in 2009, and thus far in 2010 is at 1,850 per month.

The price chart over that time span looks similar: the average home in 2008 sold for $220k.  That dropped to $199k in 2009 and is up to about $210k this year.  It also bears mentioning that at our peak in 2007, the average price of homes sold was $231k, which is only a $20k difference from today, which represents only about an 8.6% difference.  Ask the folks in Florida or Nevada if they’d take an 8.6% drop…

Overall, tight credit and jittery buyers is preventing more folks from hitting the pavement to buy a house, but all in all, the Charlotte market is as healthy as you could ask for given the economic crash we witnessed in 2008.  With the summer about over, we can probably expect the sales numbers to drop some more, but we still suspect 2010 will stay ahead of 2009.  So if you have buyers who are trying to “time the market,” these graphs sure make 2009 look like a bottom!

Until next time… thanks for reading!

Posted via email from Charlotte real estate technology, IDX, market data

Charlotte real estate market

The market within the market: price ranges

One of the things we frequently hear from some agents is that certain price ranges are tougher to move these days than others.  One of our clients was telling us that she has no problem selling homes in the under-$200k range, but most of her listings over $200k (even ones priced very aggressively for their areas) are not getting showings.

So, we figured we’d check the numbers to see if this is a trend in Charlotte.  And sure enough, there is some validity to it.

Of the ACTIVE single-family homes on the market now, 51% of them are priced under $200k.  37% are between $200k-500k and 12% are over $500k.  Here’s a chart:

Compare to the SOLDS in 2010, where 63% them were under $200k, 30% were between $200k-500k and only 7% were over $500k.

Indeed, houses under $200k make up a larger percentage of solds than they do of actives.  That difference of 12 percentage points means that there are 23% more homes in the sub-$200k price range in “solds” than there are in “actives.”  

While there is a lower percentage of $200k-$500k homes that have sold, the percentage difference is 19%, so the negative impact on that range is not as large as the positive impact on the under-$200k range.

Where we see the greatest hit is to the over-$500k range, where there are a whopping 42% more active homes in that price range than they are “solds” in 2010.

Overall, it’s important to remember that Charlotte is doing quite well compared to many markets in the US, and based on the numbers in 2010, 2009 is looking more and more like the true “bottom.”  As you can see, activity is slightly up in 2010 (even including July’s numbers, which were down due to the expiration of the tax credit), and sales prices are about 4% higher than 2009.

And that’s the nerdy real estate stats talk for today!… Happy weekend!

Posted via email from Charlotte real estate technology, IDX, market data